Data visualization
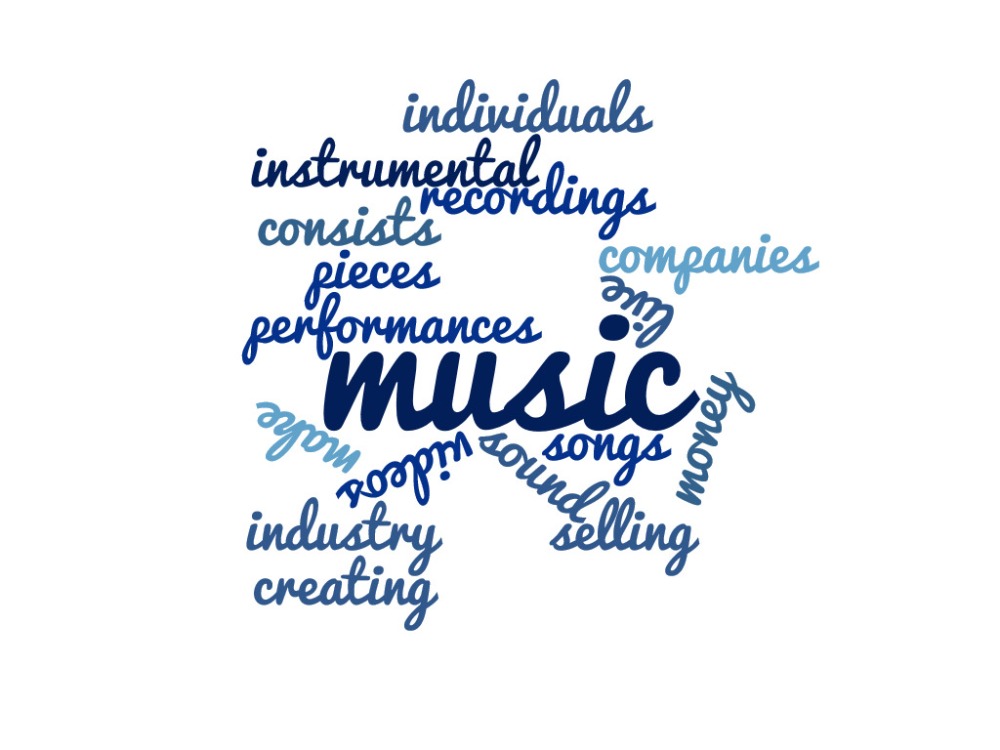
This data visualization shows what music means to me. Music show individuals and what they can do by yourself or in a group. Music is instrumental. The background sounds gives the song excitement and creativity! The recordings of music take time and effort; it is an art. You also have to be patient when recording as well. Many different companies has various types of music in order to engage various crowds. Music consists of pieces that include the artist and the sound. Performances bring out the sound of the song and allows the artist to engage with their fans and the crowd. You can live through music whether you are happy or feeling down. Music can be sold as well to make the artist and the company money. The music industry can be tough. It is important to make sure you are happy with your music to create a successful career.

Much better. Tell readers the source of your data. For example, create a hyperlink to the lyrics of the song.
LikeLike
This was talking about music in general not a particular song
LikeLike
When you click on the picture it takes you directly to the site
LikeLike
If you read the description it talks what music means to me
LikeLike
I added a link to Michael Jackson song does that help?
LikeLike